Usage and service logs
Usage
Usage shows what Onshore did over any period: for sizing, budgeting and billing.
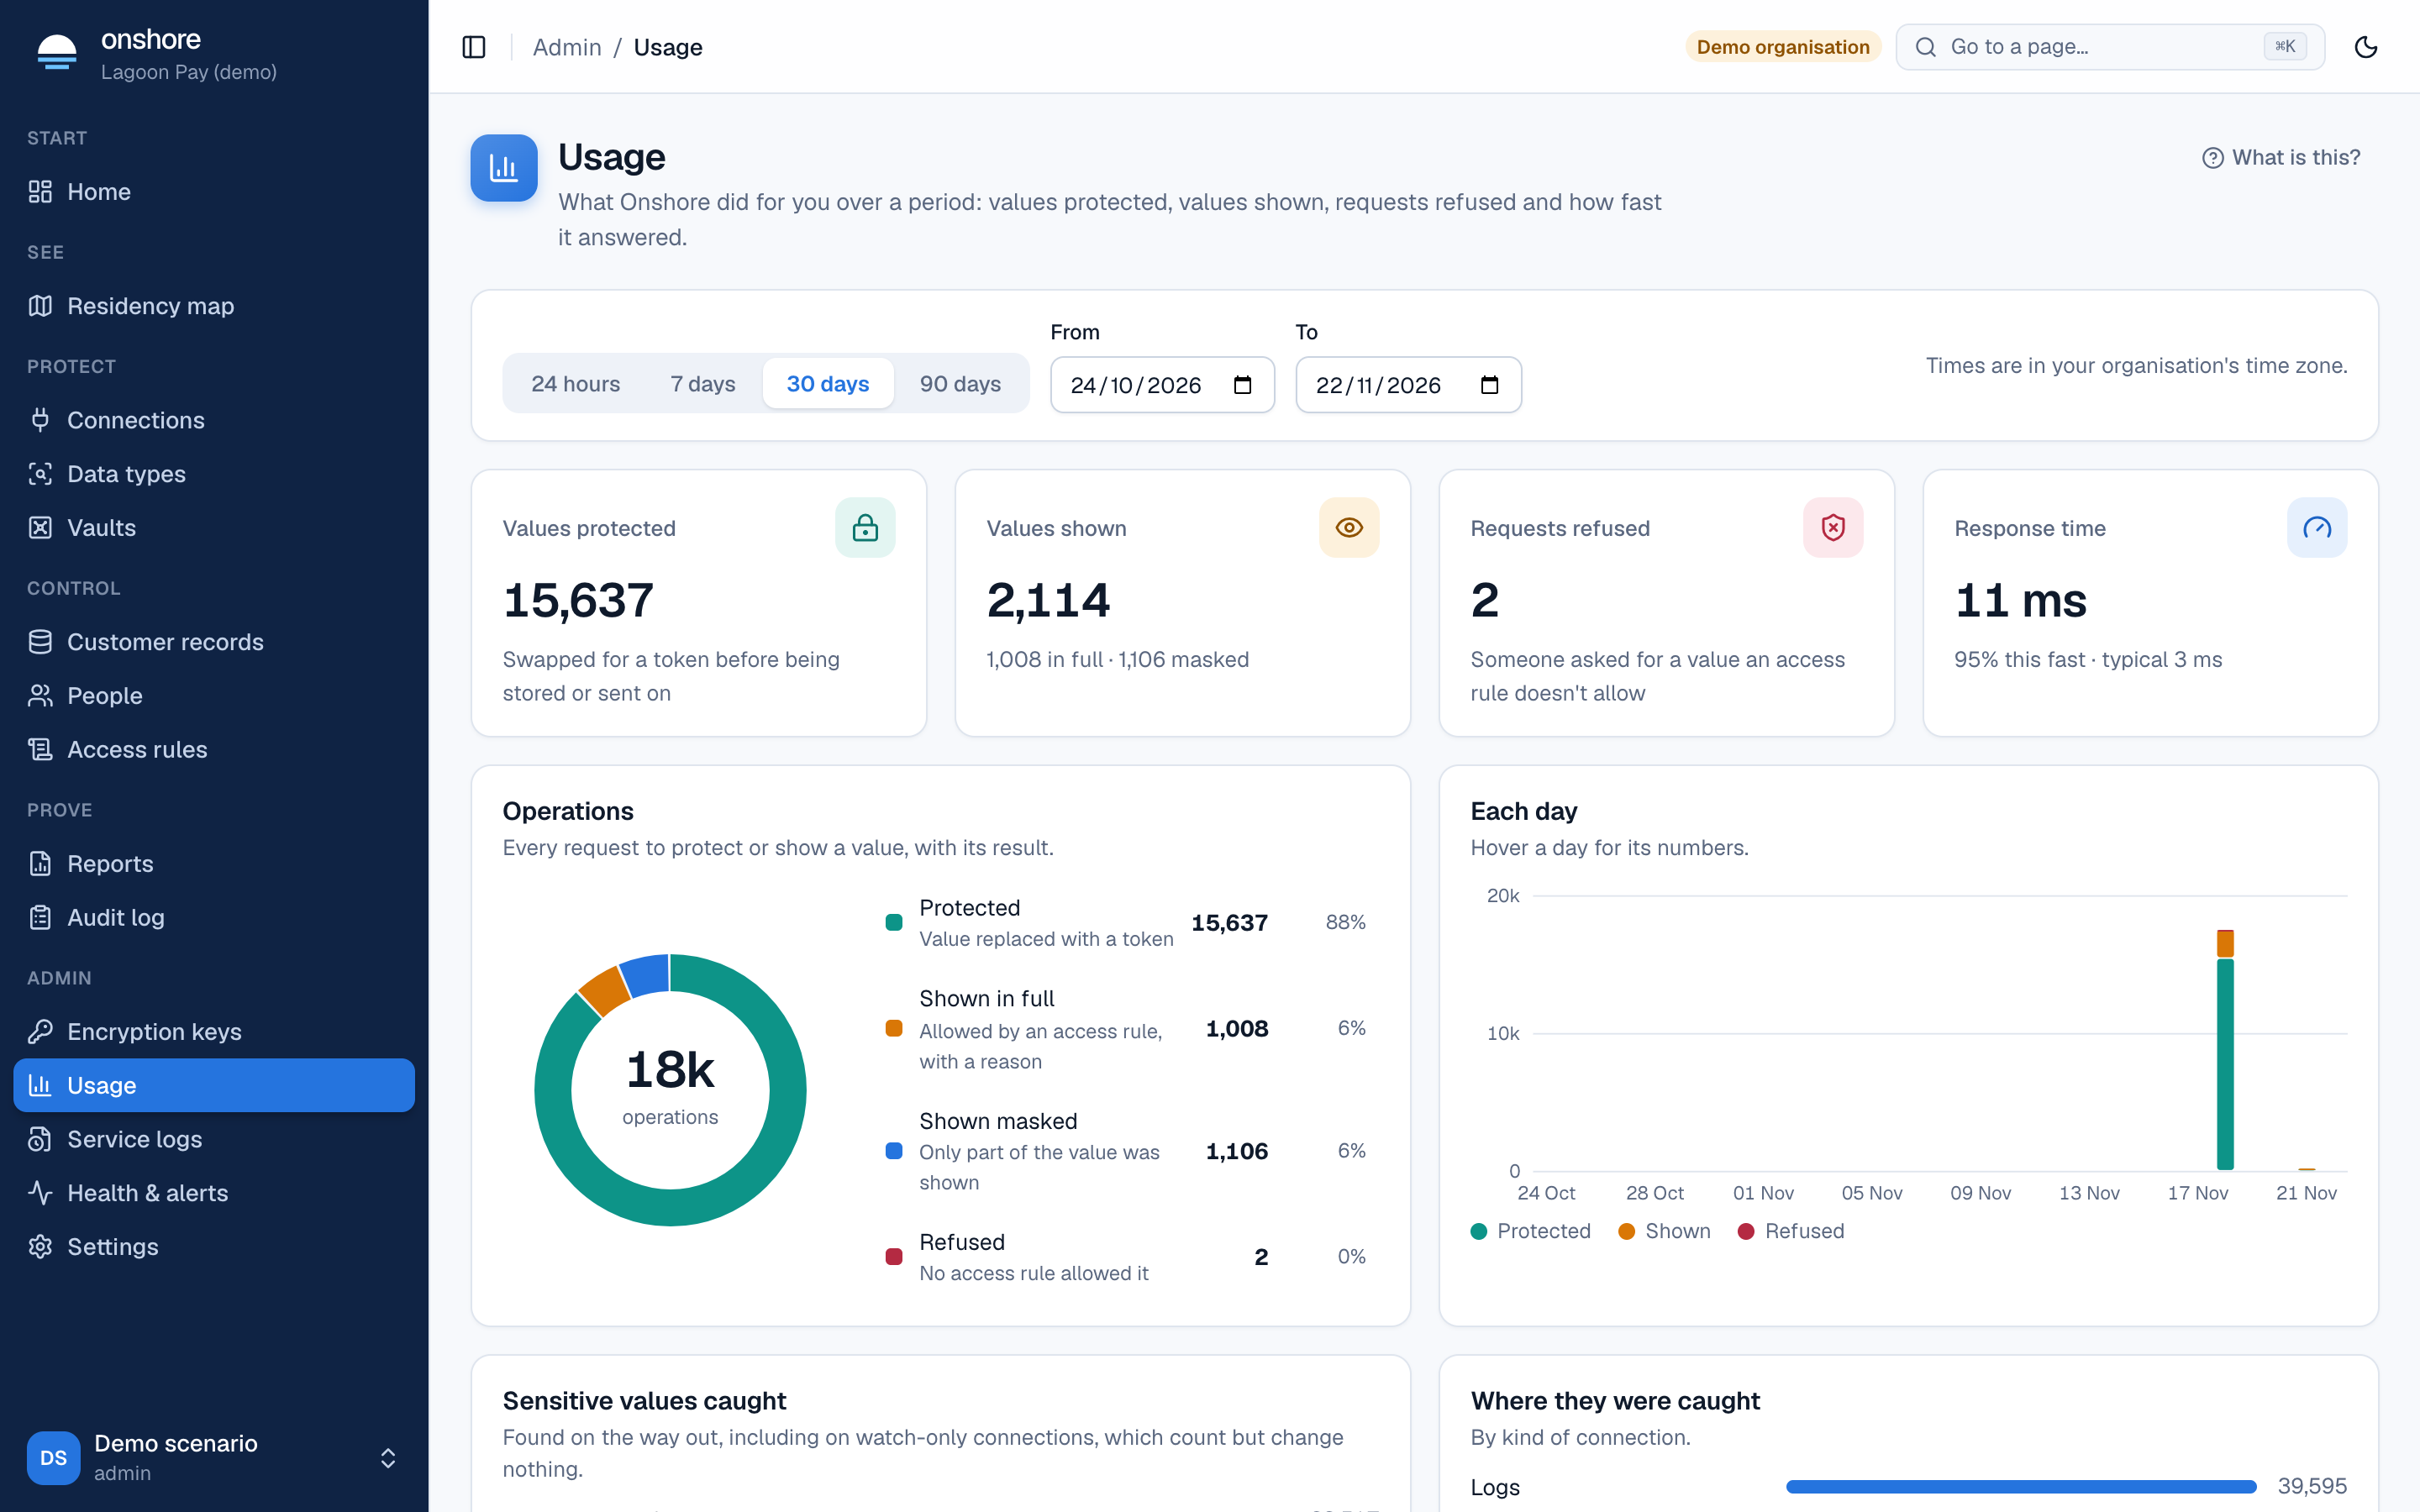
- Values protected: swapped for a token before being stored or sent on.
- Values shown: in full (allowed by a rule, with a reason) or masked.
- Requests refused: someone asked for a value no rule allows.
- Response time: how fast 95% of requests were, per service.
- Each day: hover a day for its numbers.
- Sensitive values caught: found on the way out, including on watch-only connections, and where they were caught.
Times are in your organisation’s time zone.
Service logs
Service logs lists every request each service handled. When an error message shows a request ID (req_…), find it here.
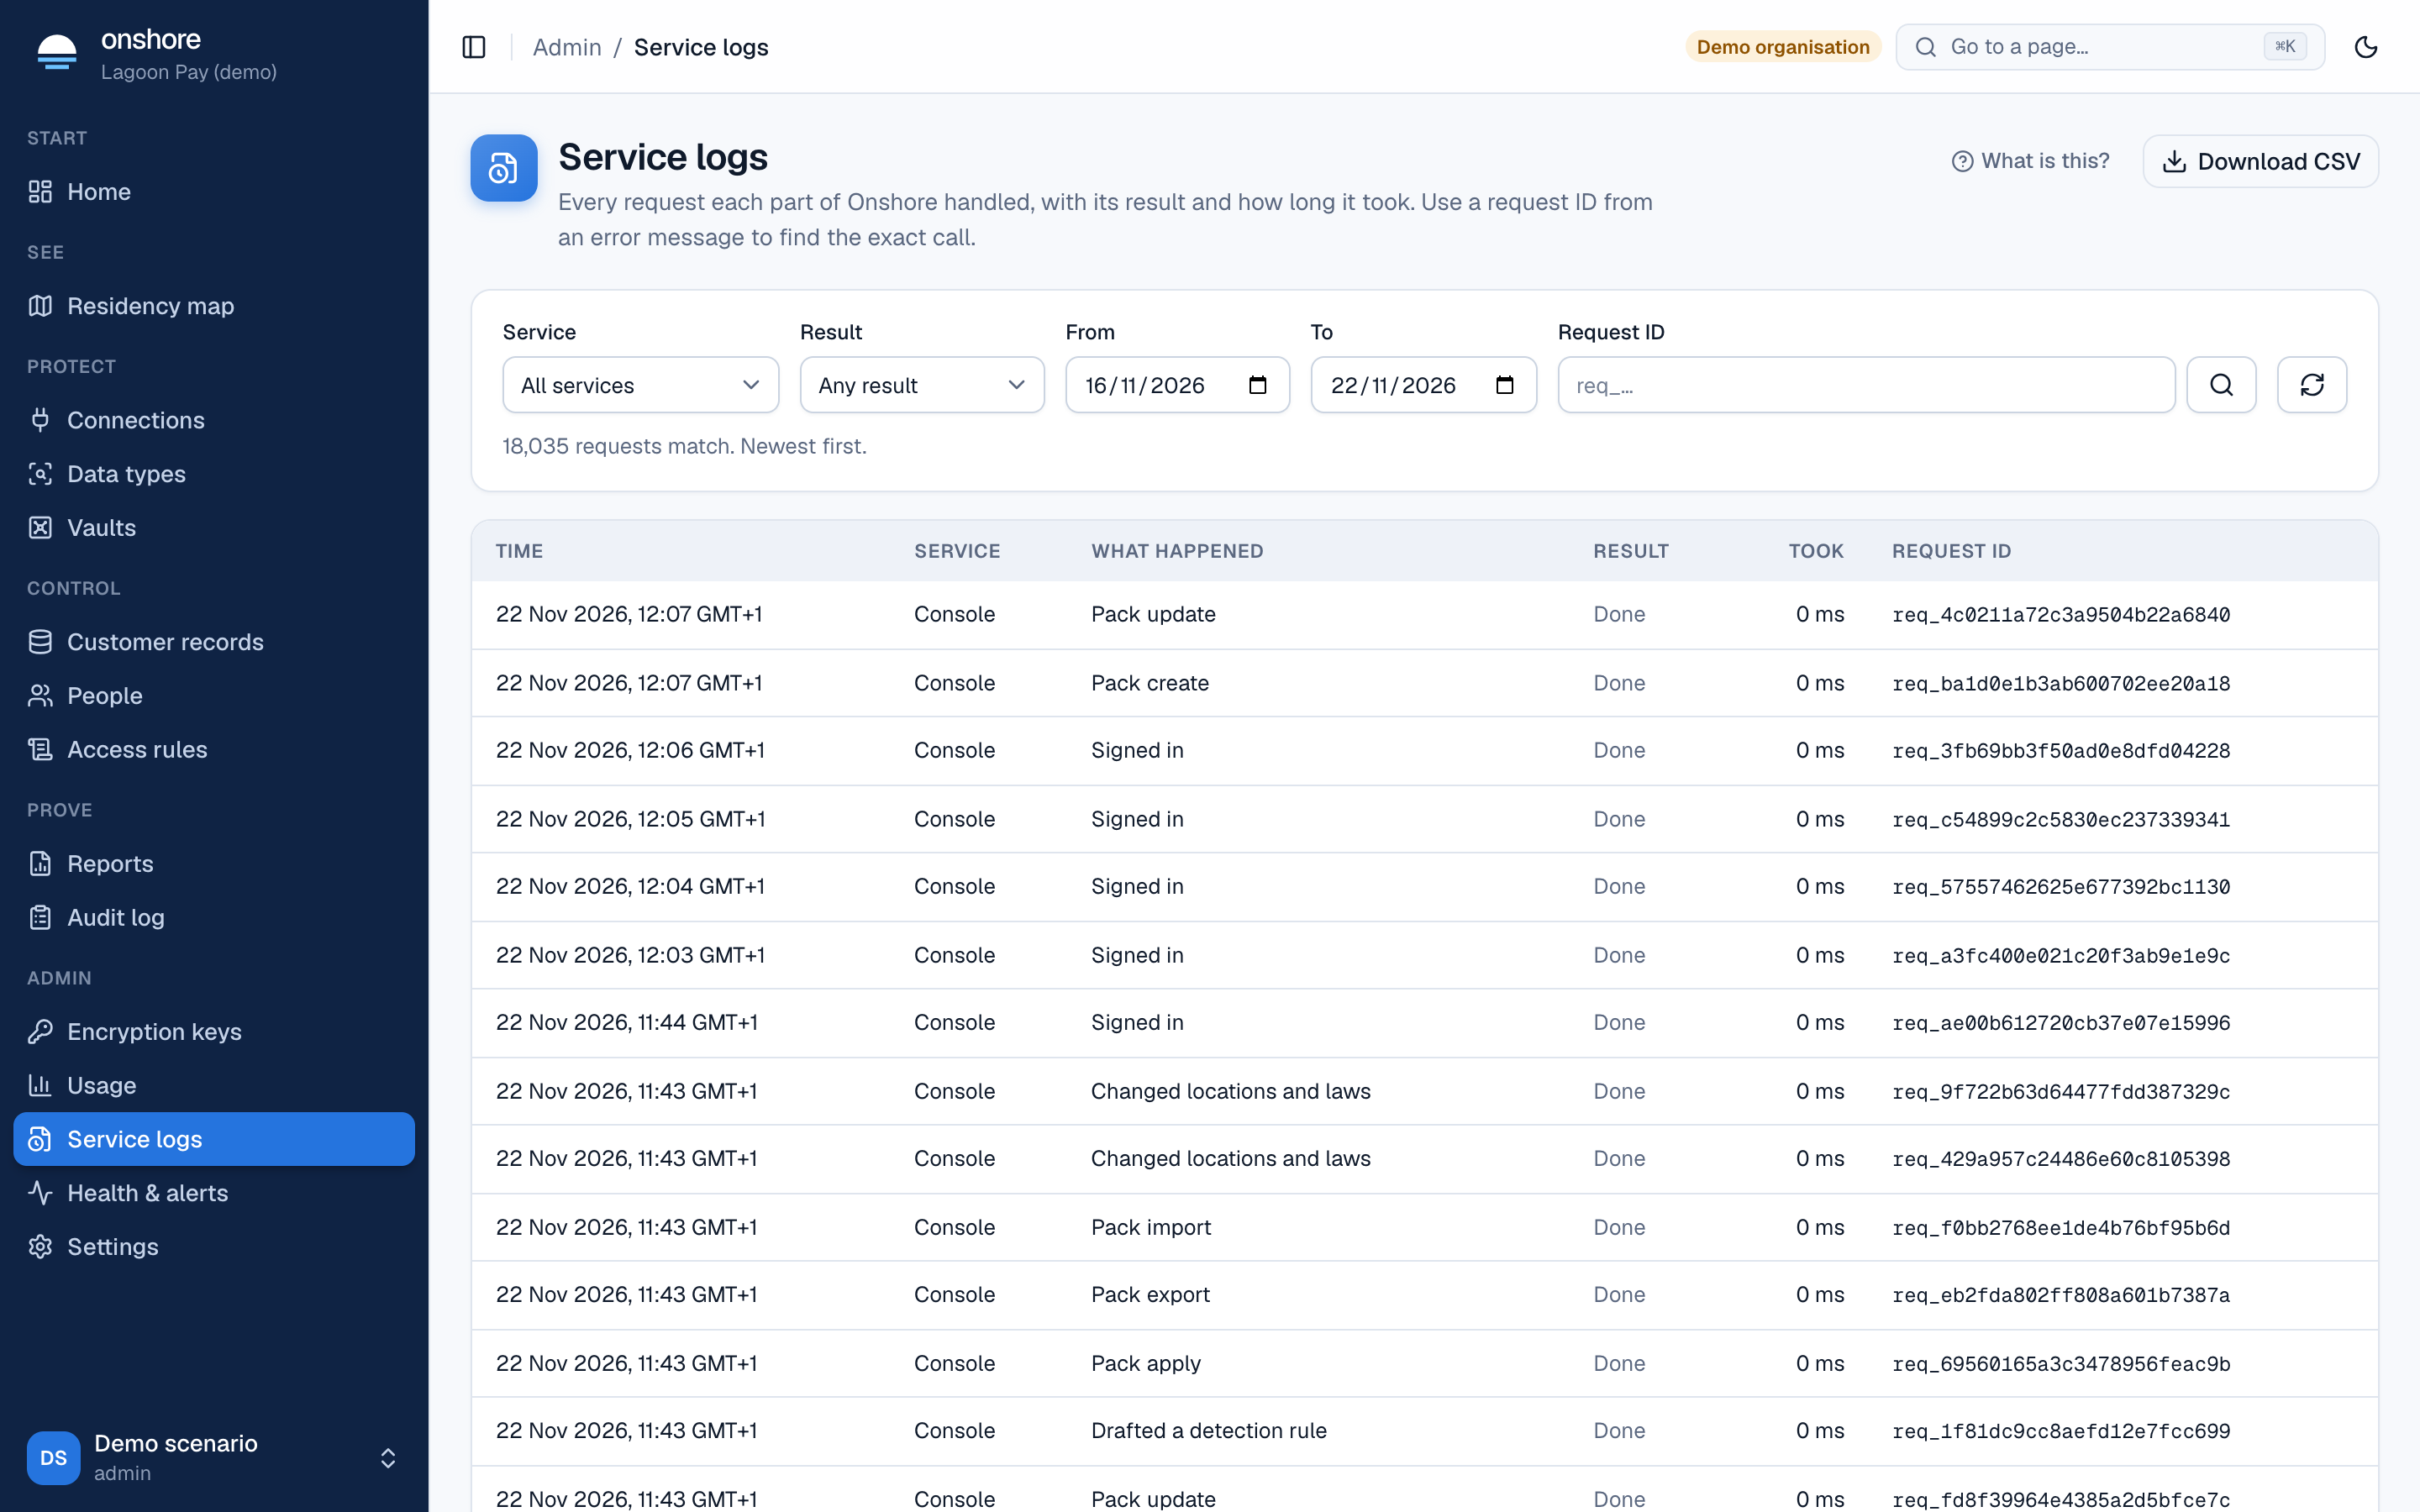
Filter by service, result, dates or request ID, page through Newer and Older, and Download CSV. Each request shows what happened, who did it, from which network and address, the vault, and how long it took.
Service logs never hold a value: they record what happened and who did it, not the data.
Last updated on