Your first connection
The quickest way to see Onshore working is to connect your logs. The setup guide (Home → setup guide) walks you through it with a test vault, so nothing touches live data.
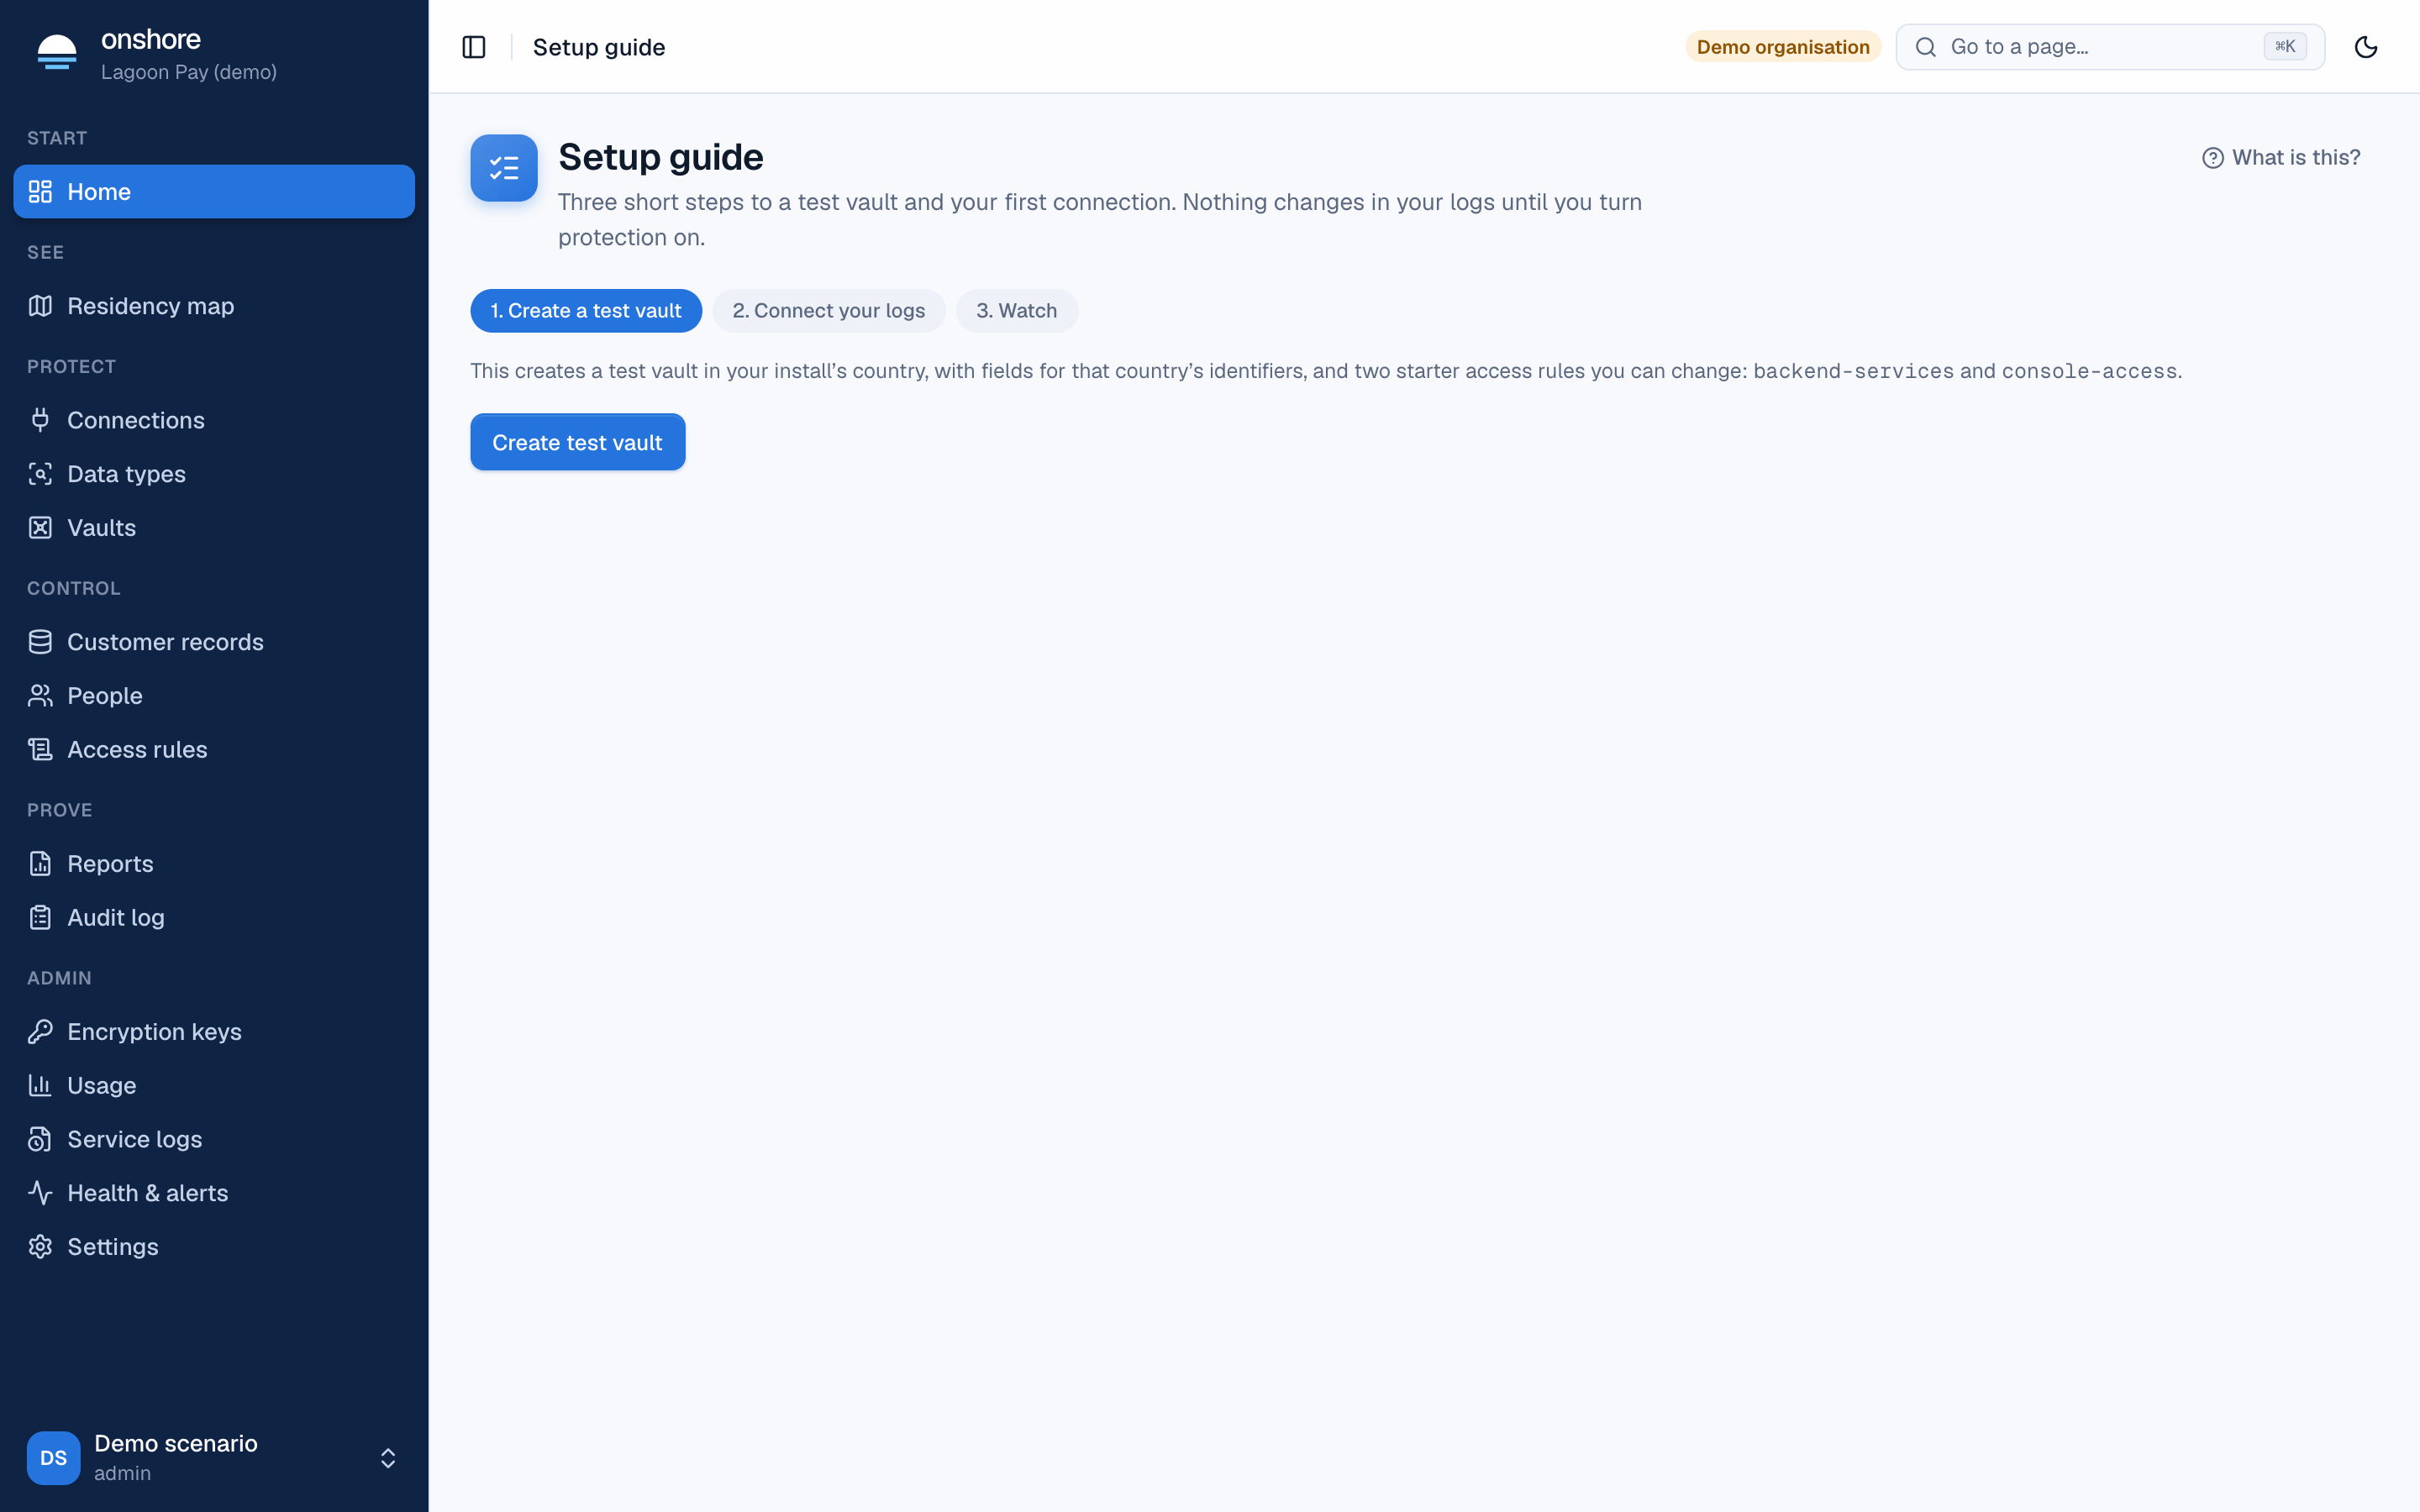
Create a test vault
Select Create test vault. Test vaults hold made-up data only; you can try values in them freely.
Say where your logs go today
Enter your log vendor’s address under Destination URL (for example your Datadog, Grafana Cloud or Elastic intake), then select Connect, watching only.
Add Onshore to your collector
The guide shows Collector settings for OpenTelemetry Collector, Fluent Bit or Vector: a new endpoint and a key. Add them to your collector, then select I have added it. Details: Log pipelines.
Watch
The connection shows Watching. Nothing has changed yet. Your logs reach your vendor exactly as before, and Onshore counts what it would have replaced. After a day or two, look at the counts on the Connections page.
Turn protection on
When the counts look right, open the connection and select Turn protection on. From then on, identifiers in your logs reach your vendor as tokens.
What next
- Protect your AI tools: AI gateway.
- Protect calls to vendor APIs: HTTP proxy.
- Store values at the source with an SDK: SDKs.