Health and alerts
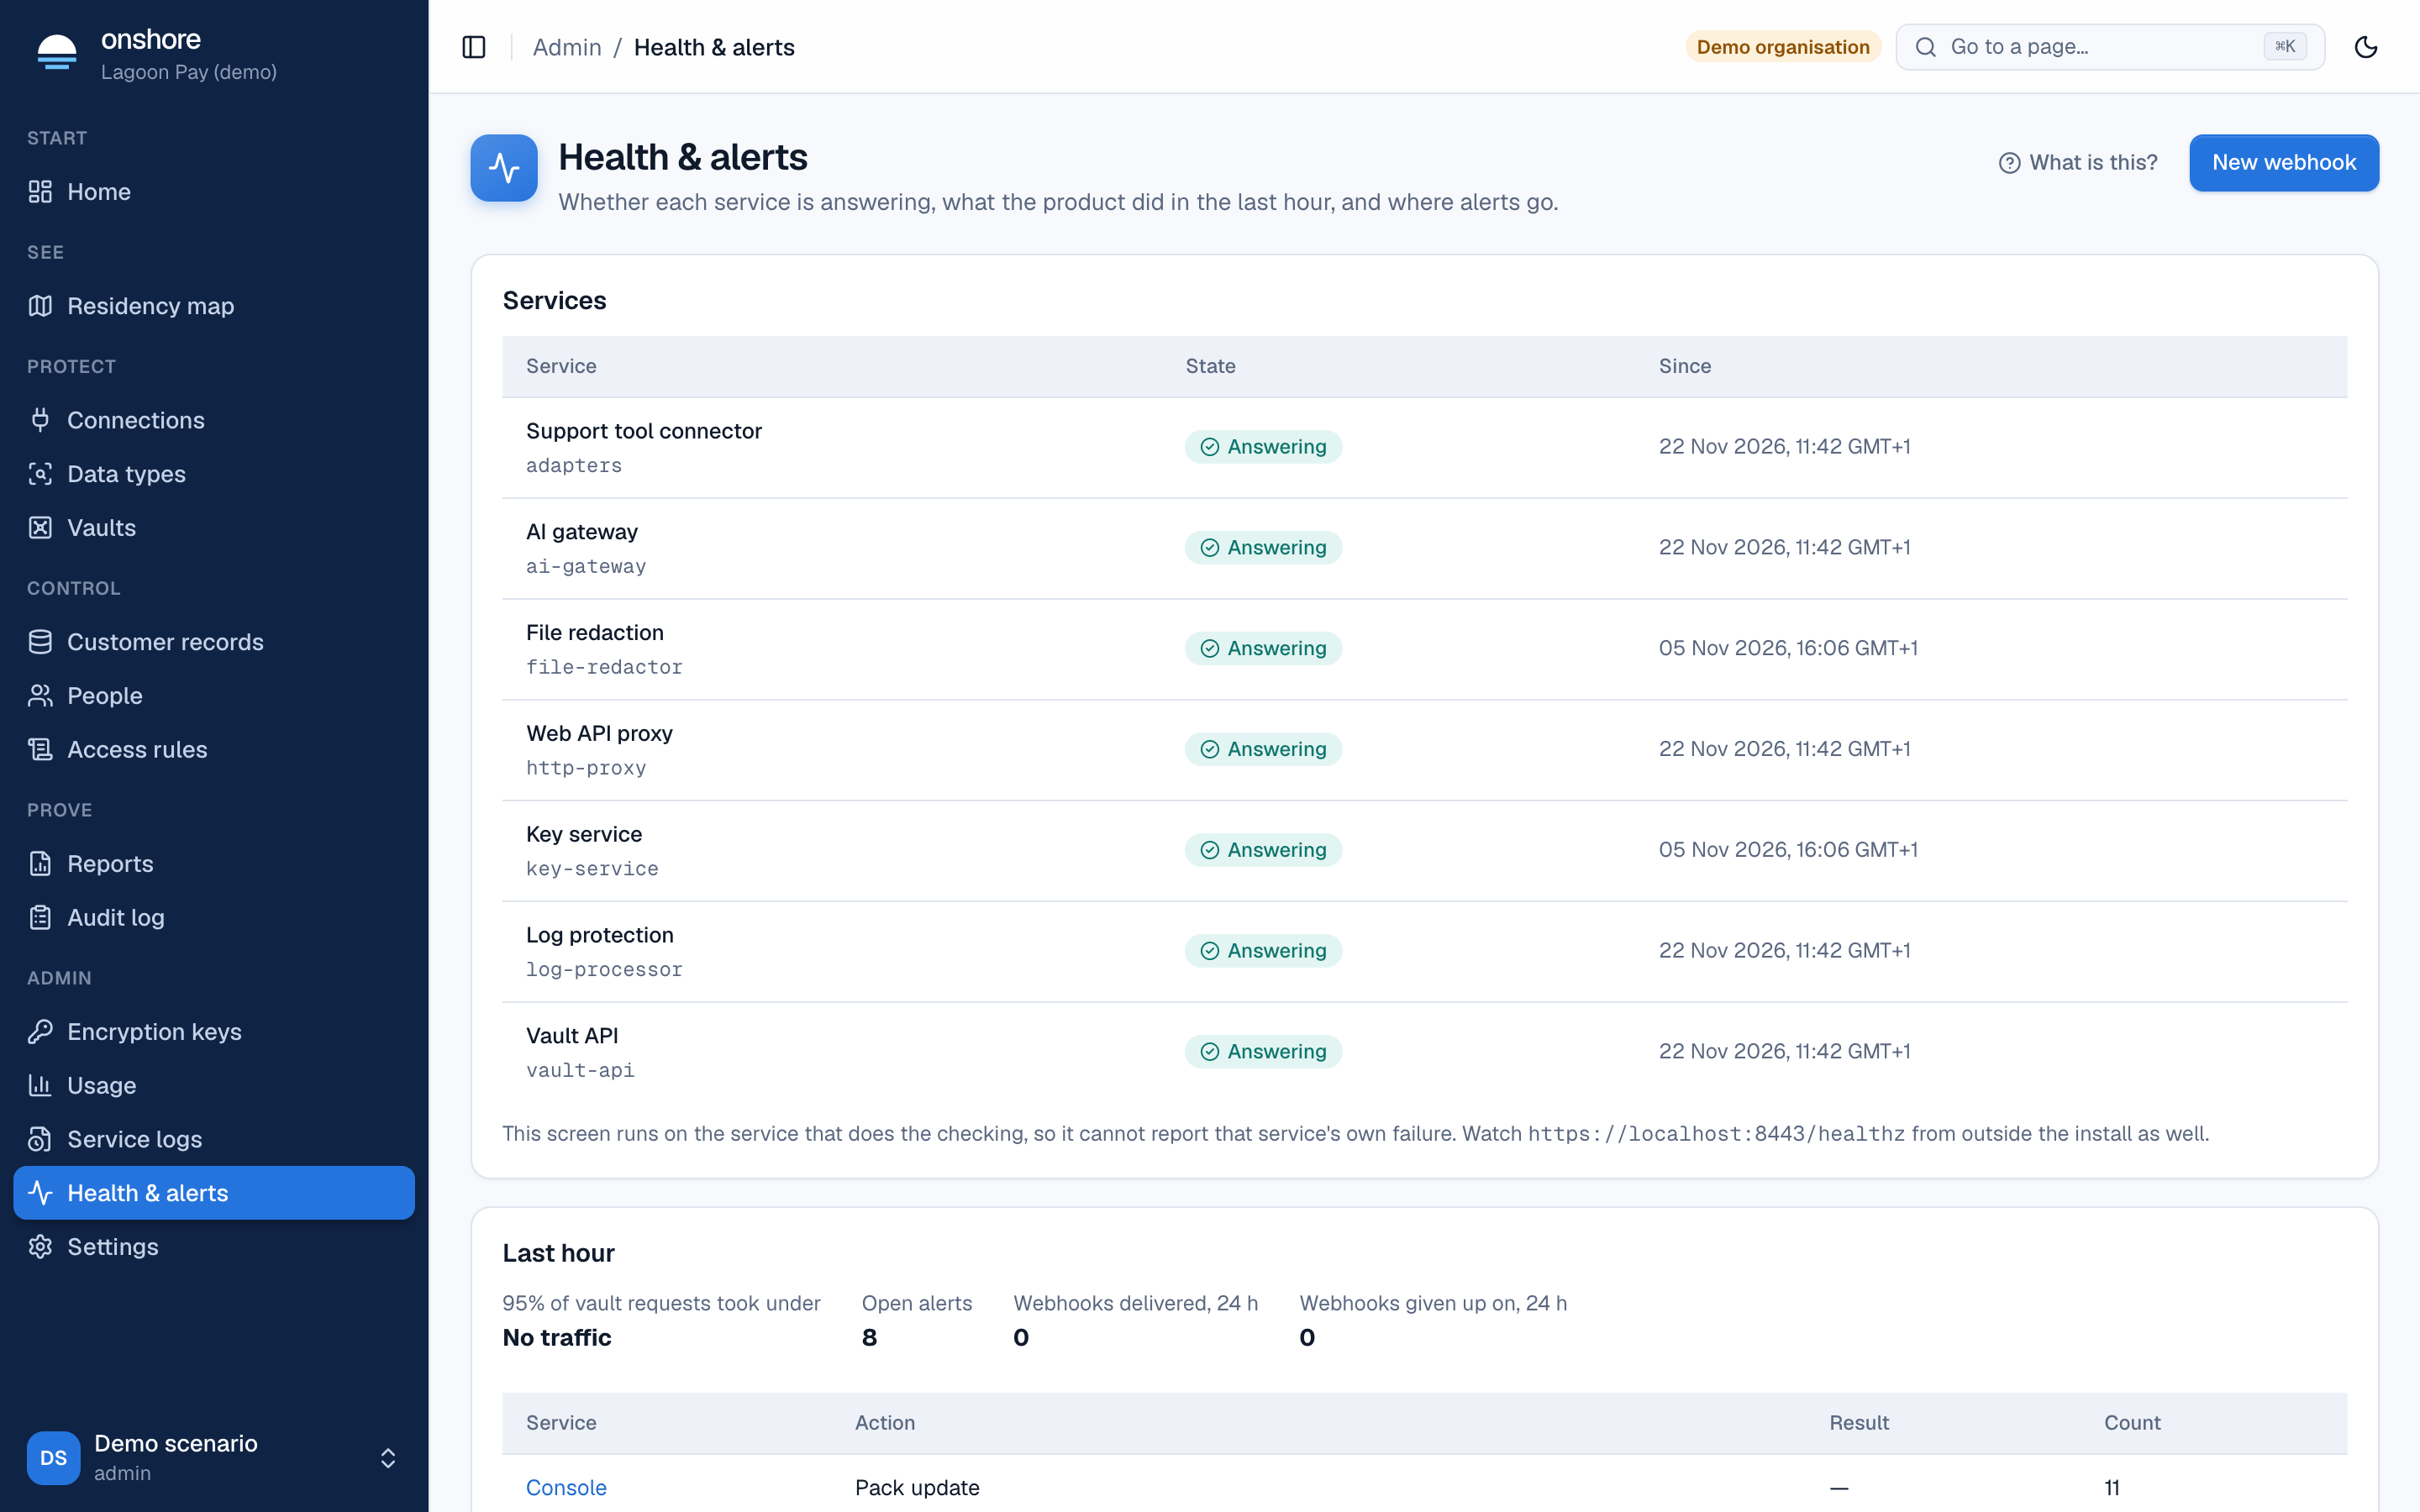
Services
Each service’s state and since when: the vault API, key service, log processor, AI gateway, HTTP proxy, file redactor, adapters. A service is checked every 30 seconds and reported down after two misses, so a failure takes up to about a minute to appear. One that’s never answered shows as Not running here, because optional services may not be installed.
Last hour
How fast 95% of vault requests were, open alerts, webhooks delivered and given up on in 24 hours, events waiting for the SIEM, and a count of actions by result.
Webhooks
Send reveals, refusals, policy changes and service failures to your own systems, such as Slack via a relay or your incident tool.
- Select New webhook, enter an
httpsaddress and choose the event types. - Copy the signing secret: it’s shown once.
- Use Send test to check your receiver.
Each webhook shows its deliveries. You can Turn off, Turn on, Rotate secret (the old one keeps signing for 24 hours) or Delete it. After 100 failures in a row, a webhook turns itself off and raises an alert.
Event types, payloads and how to check signatures: Webhooks.
Metrics for Grafana or Datadog
Create key gives a metrics key, shown once. It reads these numbers and does nothing else. Point Prometheus, Grafana Agent or Datadog at the metrics endpoint. See Metrics.
Onshore can’t report its own failure: if the control API stops, nothing is sent. Alert on a failed metrics scrape, and check /healthz from outside the install.