Console tour
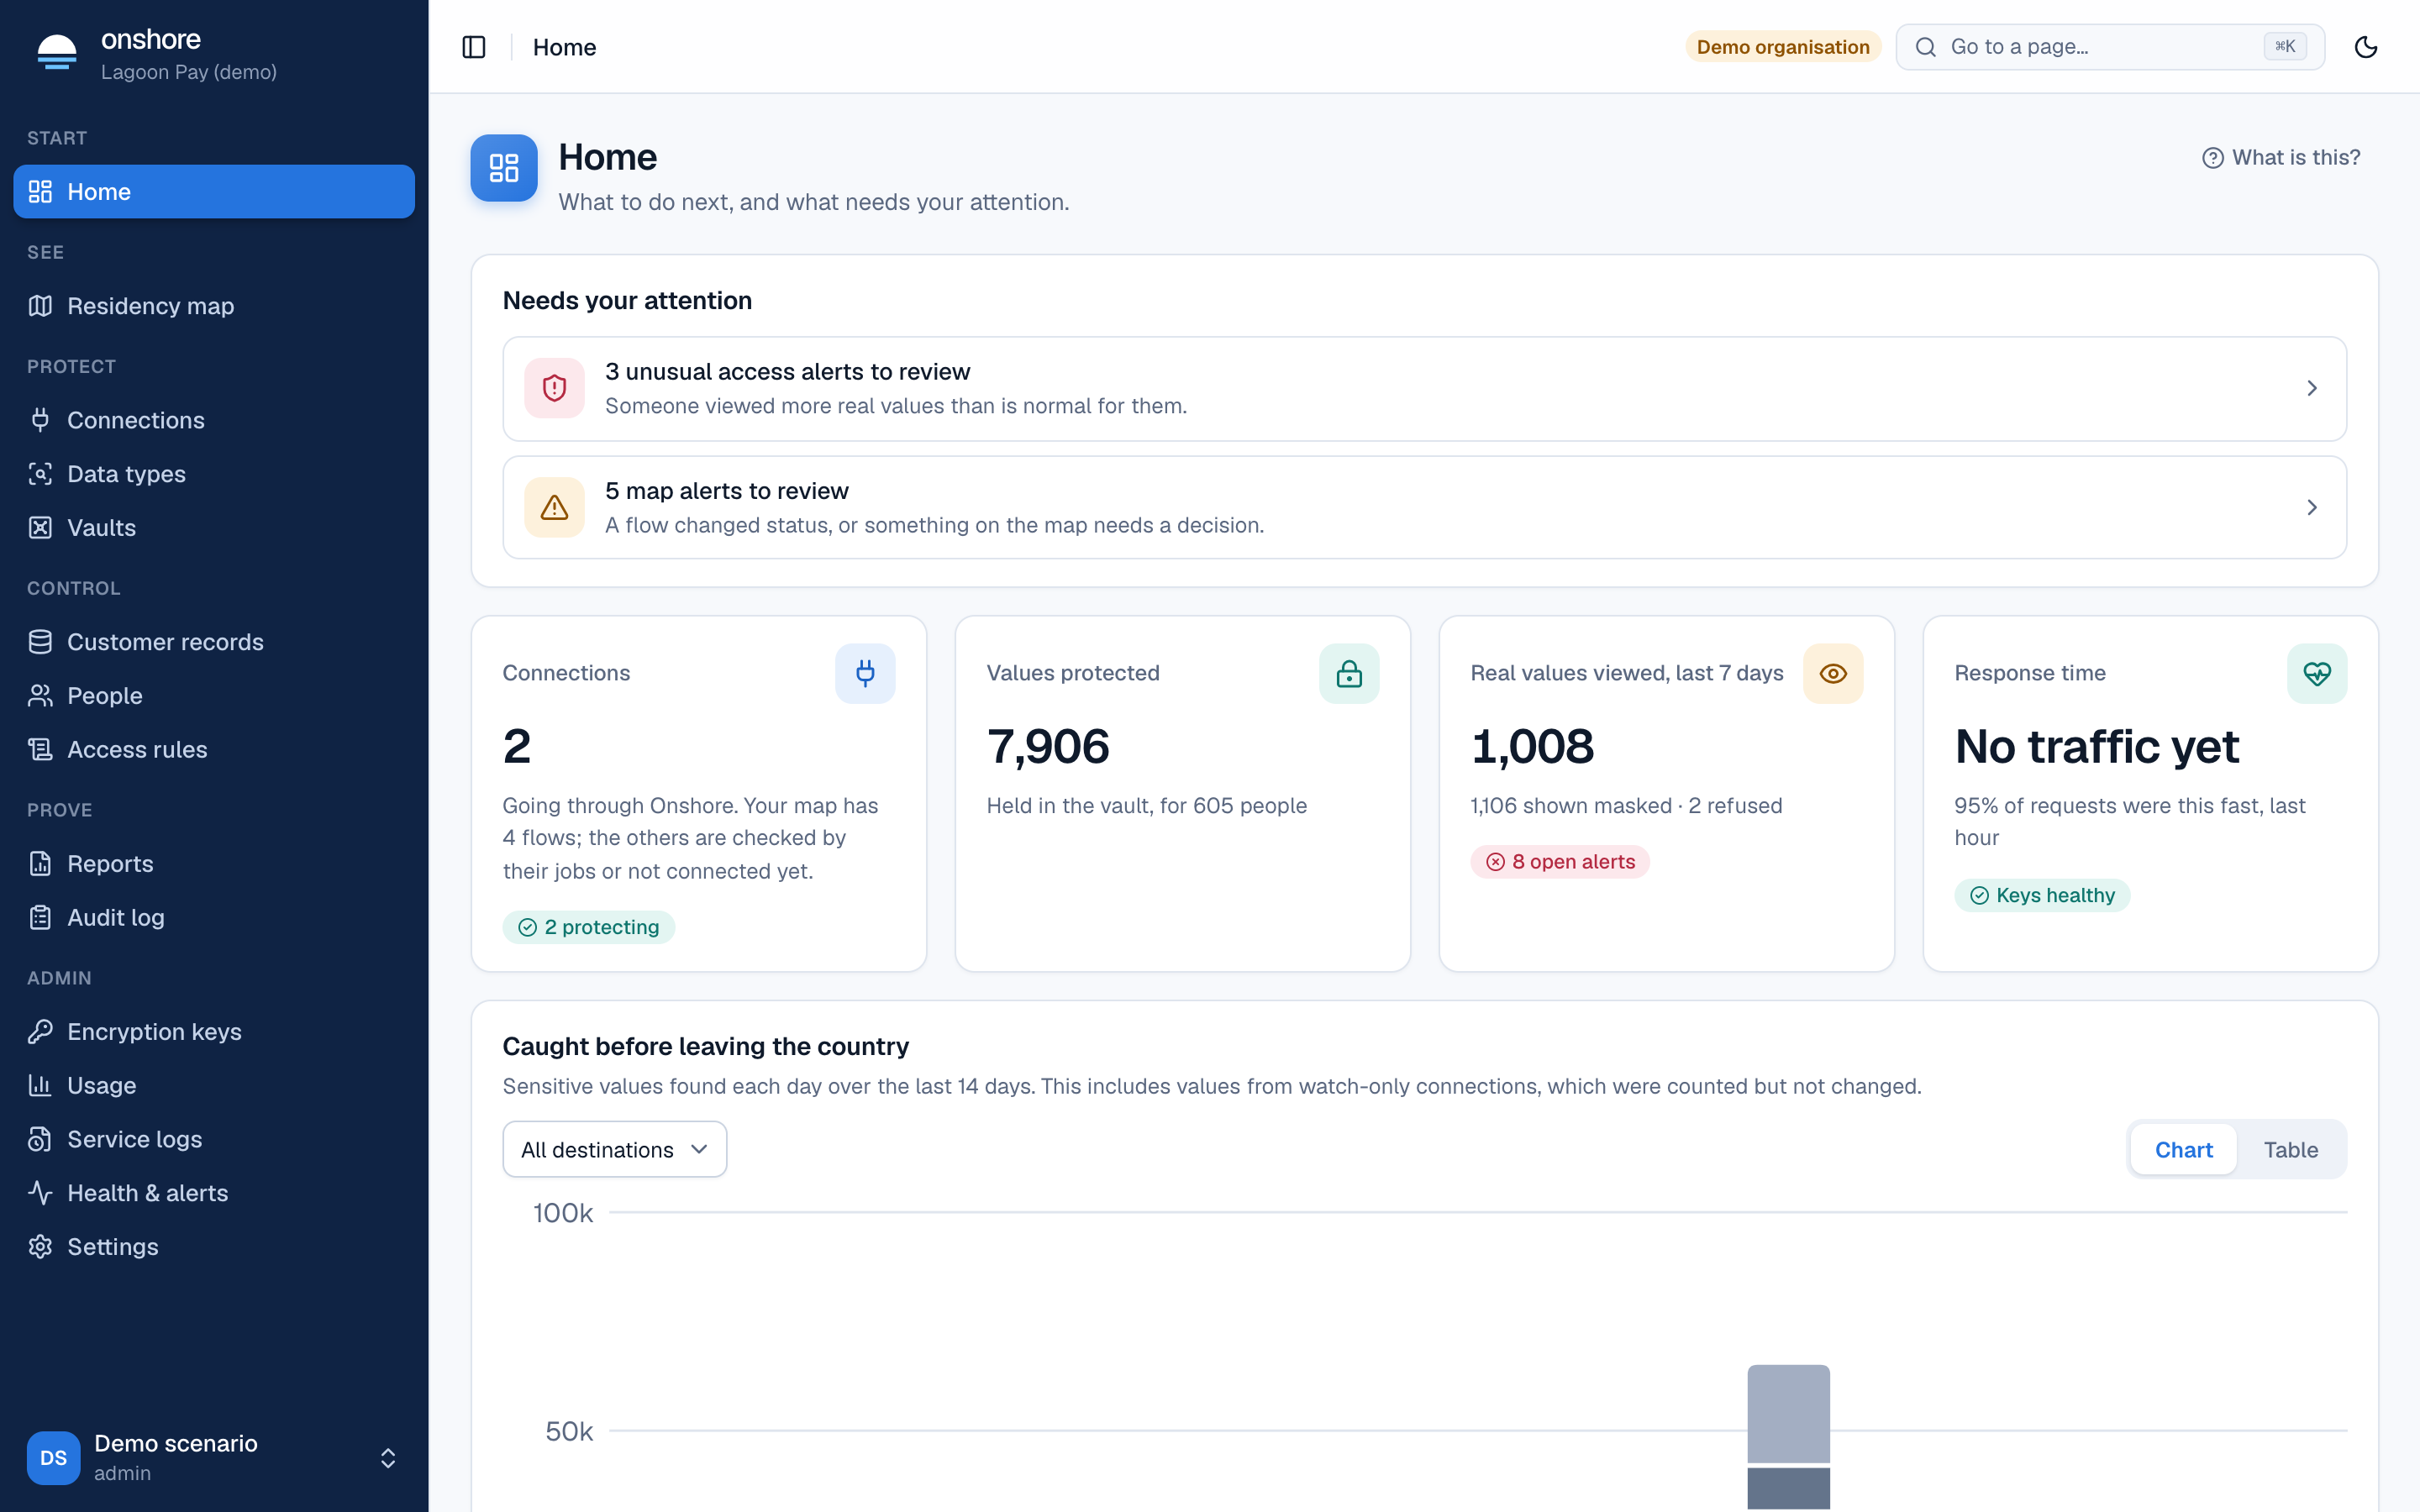
The menu on the left is grouped by the job you came to do:
| Group | Pages | What you do there |
|---|---|---|
| Start | Home | See what needs attention, and what to do next |
| See | Residency map | See where your data goes, and what still leaks |
| Protect | Connections, Data types, Vaults, Redact a file | Put Onshore in the path of your data, and decide what counts as sensitive |
| Control | Customer records, People, Access rules | Find a person’s data, manage your team, decide who sees real values |
| Prove | Reports, Audit log | Produce signed evidence and answer “who saw what” |
| Admin | Encryption keys, Usage, Service logs, Health & alerts, Settings | Keys, measurements, service health, organisation settings |
You see only what your role allows. A support agent, for example, sees fewer pages than an admin.
Finding a page
Press ⌘K (Mac) or Ctrl+K (Windows, Linux), or select Go to a page… at the top, and type what you want: “keys”, “invite”, “import”.
Help on every page
Every page has What is this? at the top right. It opens a short explanation of the page and links to these docs.
The top bar
- Demo organisation appears when the install runs the demo data. Real installs don’t show it.
- The moon icon switches between light and dark.
- Your name at the bottom left opens your account: your details, sign-out and language.
Language
The console speaks English and French. An admin sets the organisation’s language in Settings → Locations and laws.
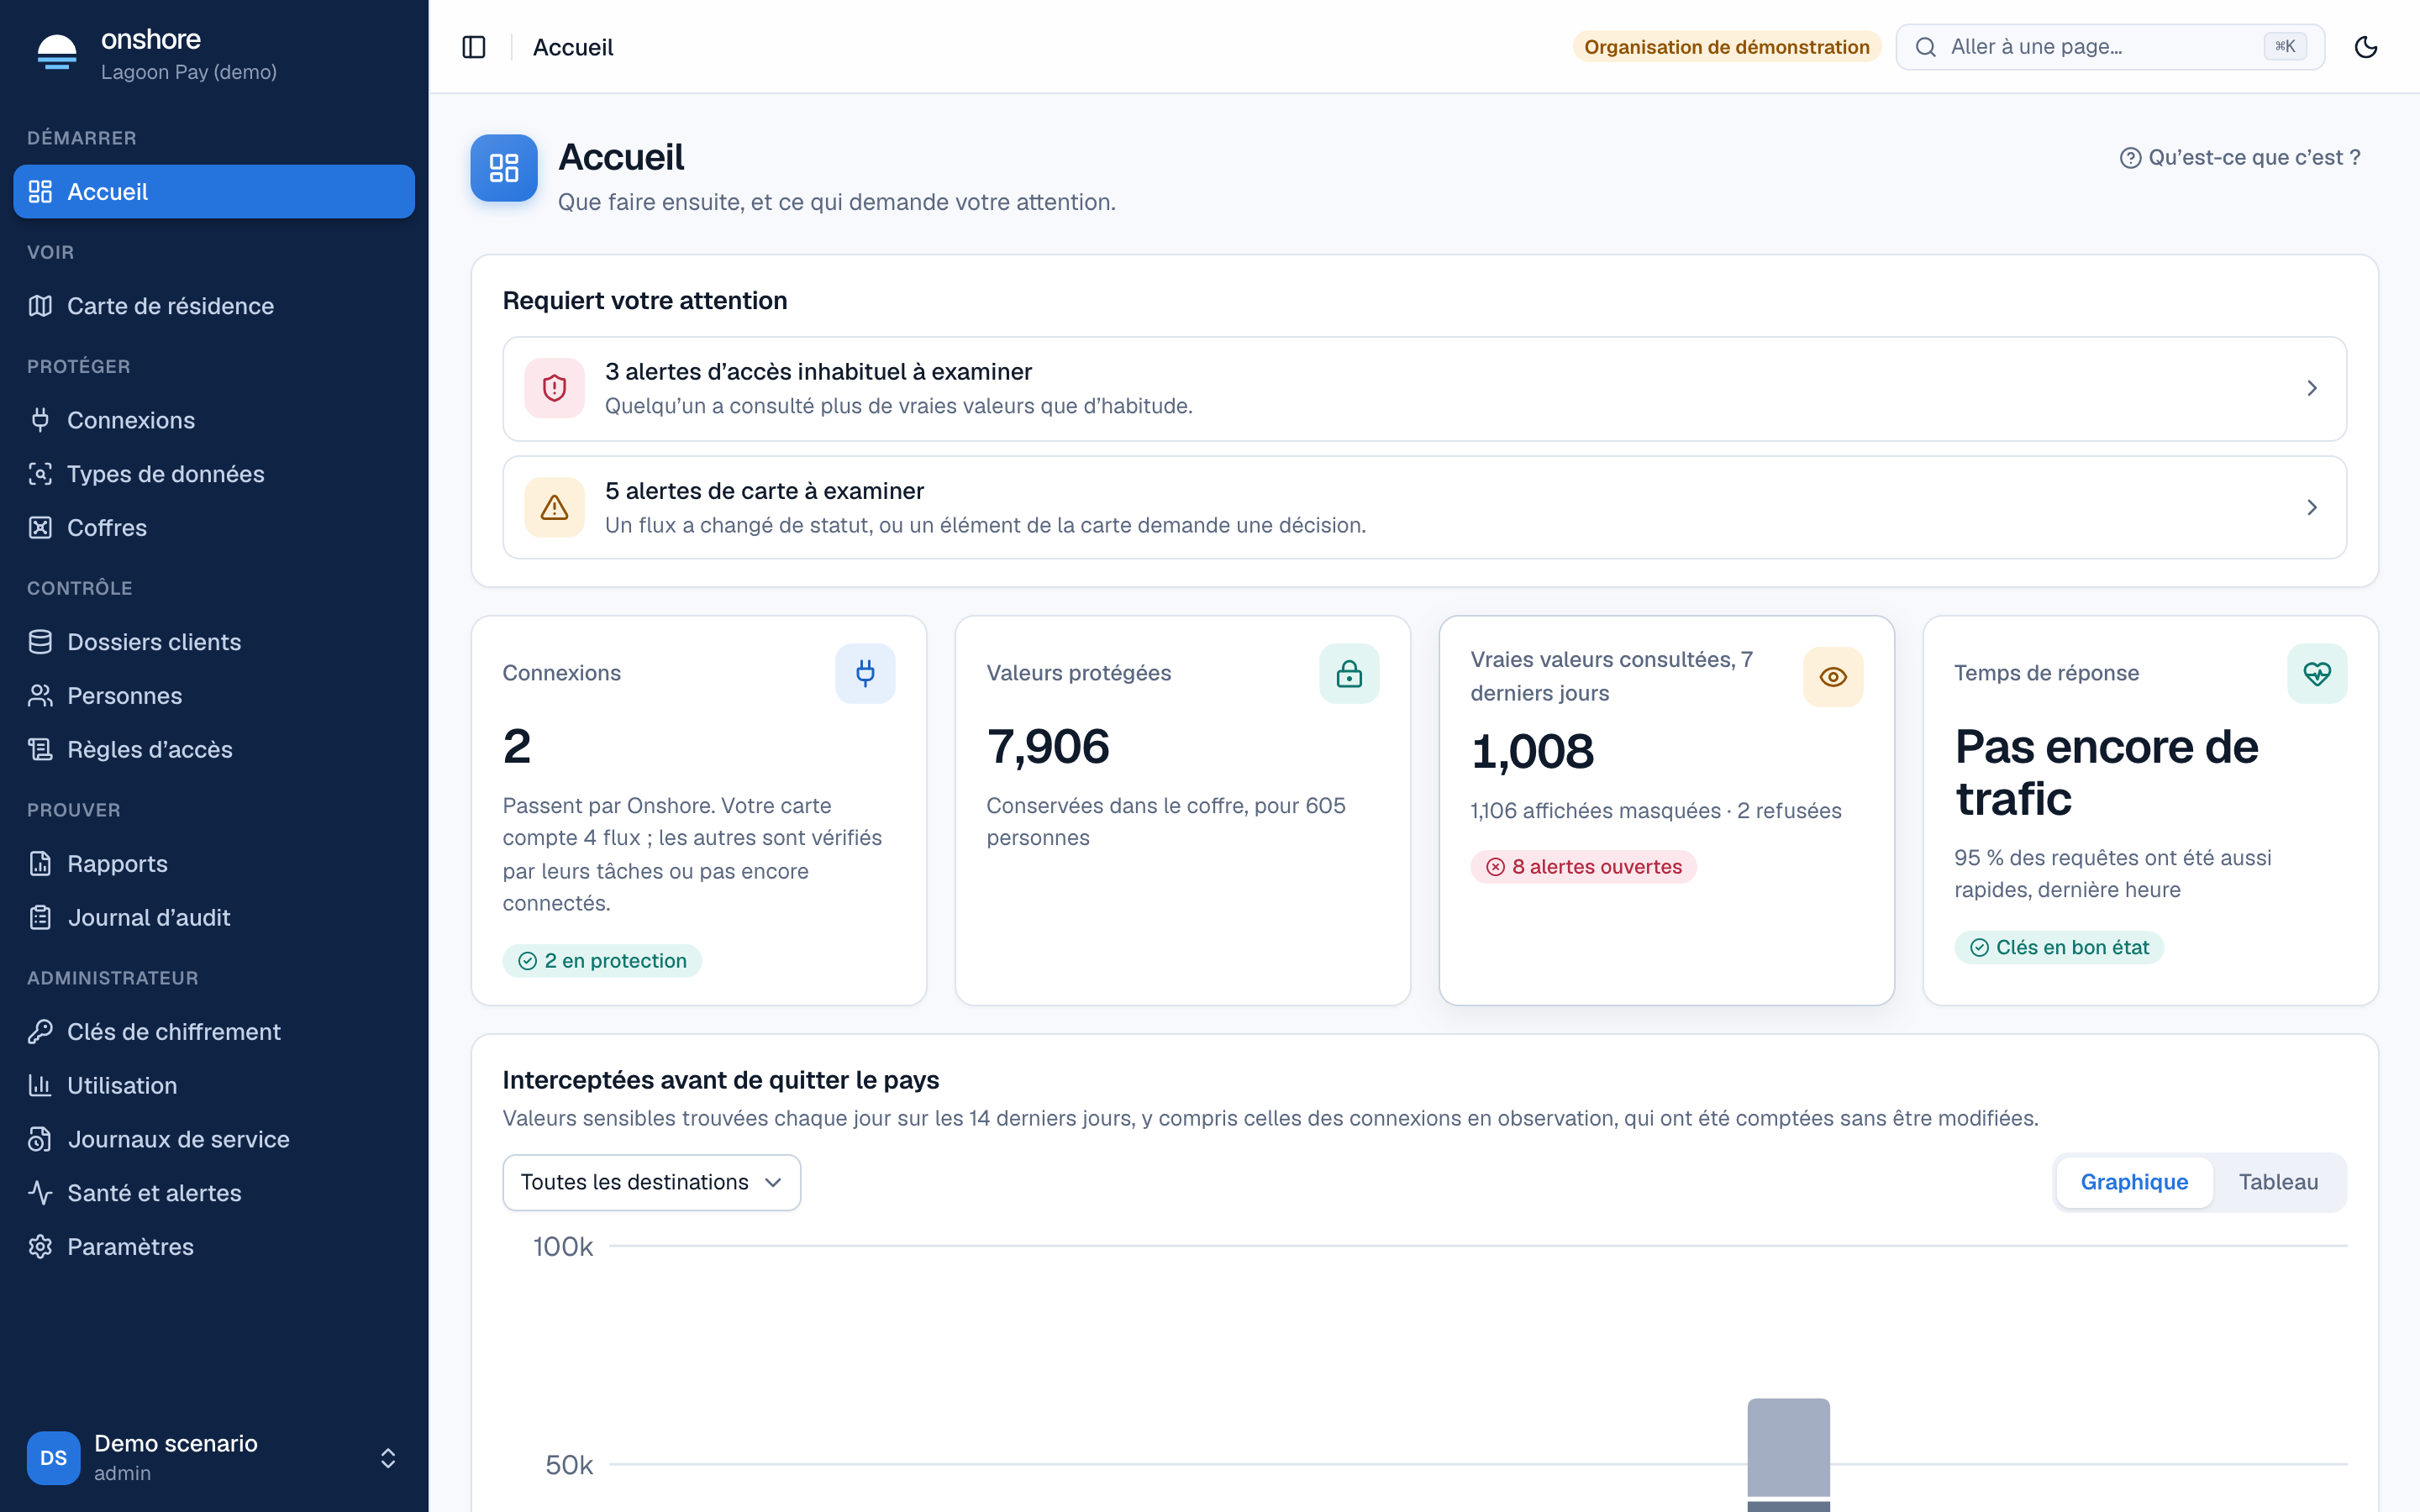
The French translation hasn’t yet been reviewed by a native speaker. Text sent by the server, such as law descriptions and error messages, emails and the PDF report, stays in English for now.
Last updated on